Setting Tables
Tables are a useful way of presenting both qualitative and quantitative data in any written piece of work and can often be very helpful in summarizing complex ideas conveyed in the text. While setting them up in LaTeX might appear a bit tedious at first, it gives you a high degree of flexibility and allows you to craft them just the way you want them to look.
Moreover, for all those who would like to present the results of quantitative analysis, many commonly used statistical tools such as Stata (esttab) or R (stargazer, xtable and others) have packages that allow you to create publication-ready LaTeX tables with one or two simple functions.
Tables are set in LaTeX using the tabular environment. The tabular environment begins with \begin{tabular}{cols} and ends with \end{tabular}. Instead of cols, however, we specify the number of columns our table has, as well as the location of text in each of them. So, for example, {ccc} would mean three columns with text centred in each of them, while {lr} would mean two columns, first one with text aligned to the left and the second one to the right. The three basic tabular column types are:
- l – left-justified text in column
- c – centred text in column
- r – right-justified text in column
After defining the table, each row is entered by simply entering the content of each cell separated with the ‘&’ character row-wise. To notify LaTeX that a row ends, you use ‘\\’, the same character used to insert new line outside of the tabular environment. Note that the number of entries in each row must always match the number of rows specified in the curly braces at the beginning of the tabular environment. You can see a basic table in the example.
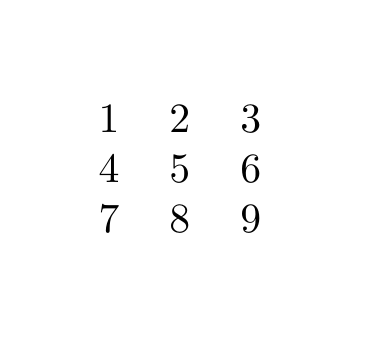
As you can see, the output produced by the example does not look too impressive. It may also appear quite tedious to enter all those ‘&’ characters. Fortunately, TexStudio comes in handy with a button allowing you to enter a new row automatically and then only fill in the blank spaces with your content. It is located on the right-hand side of the application toolbar, several buttons to the right from the “compile” button, as seen below.

Separation Lines
To make it look a bit more like a table, you can add lines separating rows and columns. For rows, this is specified by adding the \hline markup tag after the row you want the line to appear. For columns this is set alongside the column specification in the curly braces following the beginning of the tabular environment, using the vertical bar character ‘|’. For example \begin{tabular}{c||c||c} means three columns with text centered in cells, separated by double vertical lines. Both can be seen in the example below:
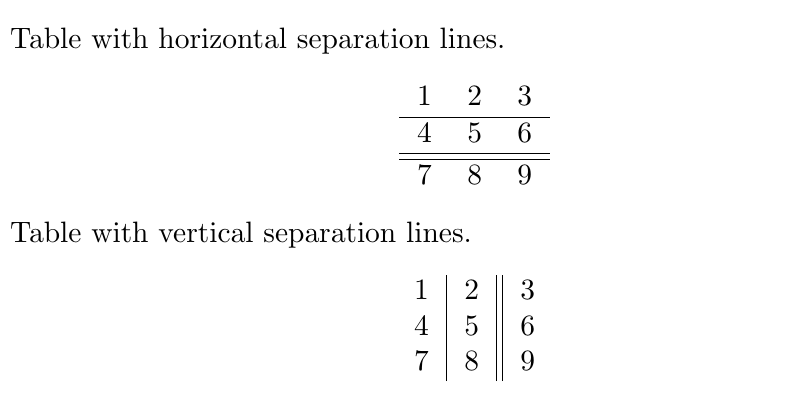
Table with horizontal separation lines.
\begin{center}
    \begin{tabular}{ccc}
        1 & 2 & 3 \\
        \hline
        4 & 5 & 6 \\
        \hline
        \hline
        7 & 8 & 9 \\
    \end{tabular}
\end{center}

Table with vertical separation lines.
\begin{center}
    \begin{tabular}{c|c||c}
        1 & 2 & 3 \\
        4 & 5 & 6 \\
        7 & 8 & 9 \\
    \end{tabular}
\end{center}
Only because something is possible, does not mean you should do it. Never ever ever use vertical lines in a Table!
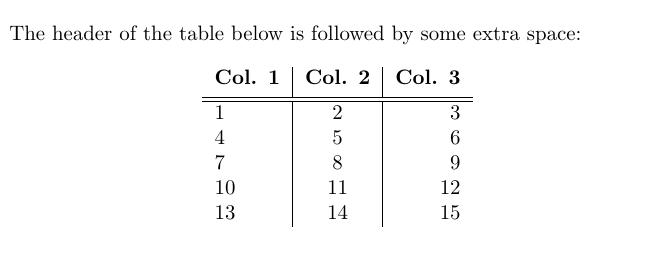
You can also use the brackets at the end of a row to add extra spacing before the beginning of the next row, which is particularly useful for table headers. Note that you need to specify the value and then the unit first – for example, [0.5ex] corresponds with roughly half of the height of a lowercase ‘x’ letter in the current font, while [0.5cm] would mean 0.5 centemeters. Check units in LaTeX for more information.
\begin{center}
    \begin{tabular}{l|c|r}
     \textbf{Col. 1} & \textbf{Col. 2} & \textbf{Col. 3} \\ [0.5ex]
     \hline \hline
     1 & 2 & 3 \\
     4 & 5 & 6 \\
     7 & 8 & 9 \\
     10 & 11 & 12 \\
     13 & 14 & 15 \\
    \end{tabular}
\end{center}
Fixed Width of Columns
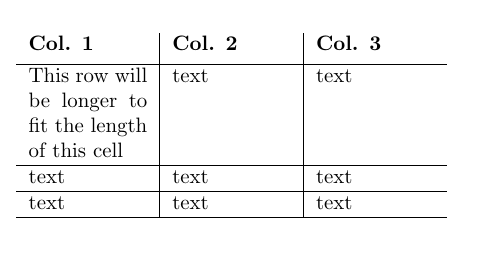
If you need to keep the width of a specified column, you can do that by using the p column type followed by curly braces indicating your desired width. As a result, if your text width exceeds the width of the row, it will be wrapped and the width of the row will decrease, as seen in the example.
\begin{center}
    \begin{tabular}{ p{2cm} | p{2cm} | p{2cm} }
     \textbf{Col. 1} & \textbf{Col. 2} & \textbf{Col. 3}\\ [0.1cm]
     \hline
     This row will be longer to fit the length of this cell & text & text \\
     \hline
     text & text & text\\
     \hline
     text & text & text\\
     \hline
    \end{tabular}
\end{center}
Controlling Vertical Adjustment
As you might have noticed, the p column type discussed in the previous section aligns each row to the top border of the row. Sometimes, it might be useful to centre the content of each row vertically or align it to the bottom border. This can be done with the column types m{width}, which centres the column text vertically and b{width}, which aligns it to the bottom. These columns can be found in the array package, which can be loaded by putting \usepackage{array} in the preamble of your document, similarily to the way it was done when loading the graphicx package used for including images in your document. Remember that you have to specify the width of these column types in any of the units supported by LaTeX, just as in the case of the p{width} column type.
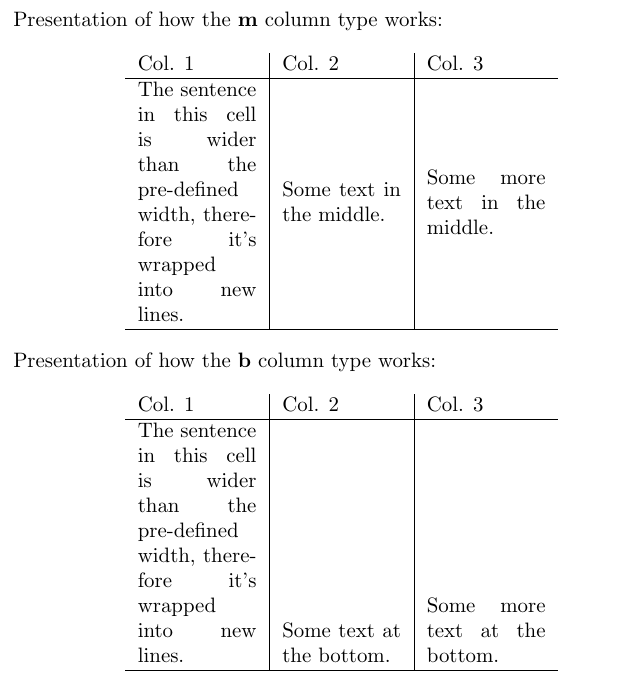
Presentation of how the \textbf{m} column type works:

\begin{center}
    \begin{tabular}{m{2cm}|m{2cm}|m{2cm}}
    Col. 1 & Col. 2 & Col. 3\\
    \hline
    The sentence in this cell is wider than the pre-defined width, therefore it's wrapped into new lines. & Some text in the middle. & Some more text in the middle. \\
    \hline
    \end{tabular}
\end{center}

Presentation of how the \textbf{b} column type works:

\begin{center}
    \begin{tabular}{b{2cm}|b{2cm}|b{2cm}}
        Col. 1 & Col. 2 & Col. 3\\
        \hline
        The sentence in this cell is wider than the pre-defined width, therefore it's wrapped into new lines. & Some text at the bottom. & Some more text at the bottom. \\
        \hline
    \end{tabular}
\end{center}
Combining Rows and Columns
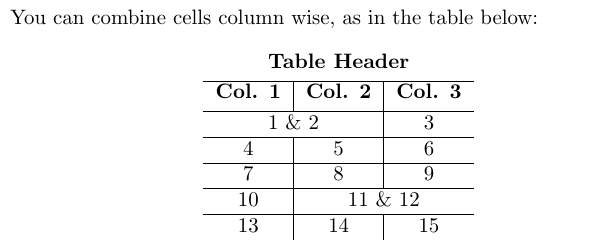
It’s also often useful to combine several cells into one, either row-wise or column-wise. To combine columns, you can use the \multicolumn markup tag. Following the tag, you need to specify three things in subsequent curly braces {number of columns}{column type}{text}. The \multicolumn tag is simply treated as a cell content, but it reduces the number of cells in a given row (i.e. if you specified {c|c|c} at the beginning of the tabular environment and you merge two rows, you will only need to specify two cells – the merged one and the remaining one.
\begin{center}
\begin{tabular}{c|c|c}
\multicolumn{3}{c}{\textbf{Table Header}} \\ [0.5ex]
\hline
\textbf{Col. 1} & \textbf{Col. 2} & \textbf{Col. 3} \\ [0.5ex]
\hline
\multicolumn{2}{c|}{1 \& 2} & 3 \\
\hline
4 & 5 & 6 \\
\hline
7 & 8 & 9 \\
\hline
10 & \multicolumn{2}{|c}{11 \& 12} \\
\hline
13 & 14 & 15 \\
\end{tabular}
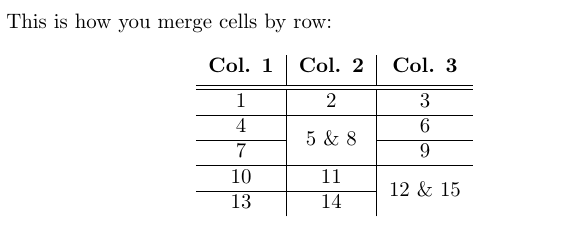
\end{center}To combine rows, remember to load the ‘multirow’ package. You can do that by putting \usepackage{multirow} in the preamble of your document. The \multirow markup tag allows you to specify three options in the curly braces – {number of rows}{width}{text}. To merge a cell row-wise, put the tag in the row in the cell in which you would like your extended cell to begin. Then specify the number of rows it will take. You can use ’*’ instead of the {width} parameters to maintain the default parameters of your tabular environment. Make sure that you leave the rows you want merged blank, as in the example below.
This is how you merge cells by row:
\begin{center}
\begin{tabular}{c|c|c}
\textbf{Col. 1} & \textbf{Col. 2} & \textbf{Col. 3} \\ [0.5ex]
\hline \hline
1 & 2 & 3 \\
\hline
4 & \multirow{2}*{5 \& 8} & 6 \\
\cline{1-1} \cline{3-3}
7 & & 9 \\
\hline
10 & 11 & \multirow{2}*{12 \& 15} \\
\cline{1-2}
13 & 14 & \\
\end{tabular}
\end{center}
The \cline{i-j} tag is a useful alternative to the \hline tag discussed before when it comes to drawing horizontal lines in tables with merged cells. Using \hline between two rows with some of the cells merged vertically would cause the line to go through the middle of the merged cells. \cline{i-j} allows to avoid that, by specifying which range of cells from the previous row should be separated horizontally from the next row. The range is specified by the values i and j in the curly braces. So \cline{2-5} will cause cells between the 2nd and 5th columns to be separated horizontally from the next row, while \cline{3-3} would separate only the cell from the 3rd column.
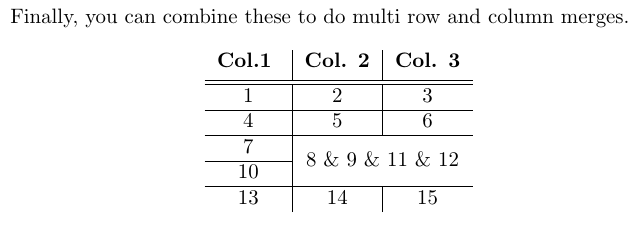
Finally, it’s possible to merge selected cells both row-wise and column-wise. To do this, you simply have to combine the \muticolumn and \multirow markup tags. For it to work, you need to first insert a \multicolumn markup tag in the first row and cell you want to merge, and then put a \multirow tag within it, specifying the number of rows you want to merge. Then, in all the following rows you want to be merged you need to specify an empty \multicolumn tag, with the same specification as the ones before.
\begin{center}
    \begin{tabular}{c|c|c}
        \textbf{Col.1 } & \textbf{Col. 2} & \textbf{Col. 3} \\ [0.5ex]
        \hline \hline
        1 & 2 & 3 \\
        \hline
        4 & 5 & 6 \\
        \hline
        7 & \multicolumn{2}{c}{\multirow{2}*{8 \& 9 \& 11 \& 12}}\\
        \cline{1-1}
        10 & \multicolumn{2}{c}{} \\
        \hline
        13 & 14 & 15 \\
    \end{tabular}
\end{center}
Tabularx
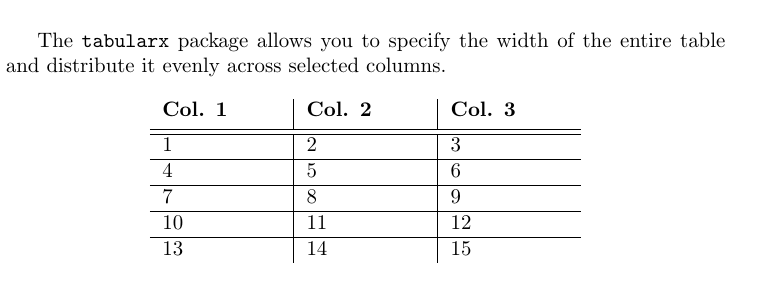
So far you’ve learned how to specify the width of individual columns using the tabular environment. In some cases, it is also good to be able to specify the width of the entire table and keep the width of each column evenly distributed across the table. This can be achieved using the tabularx package. To use it, simply insert \usepackage{tabularx} in the preamble of your document. Then you can use \begin{tabularx}{width}{preamble} instead of the tabular environment. Width specifies the width of the entire table (similarily to the \includegraphics markup tag used for including images in the document) – you can define it using various numeric units available in LaTeX (pt, cm, in) or in reference to the width of the text in the document, using \textwidth. Tabularx contains a new column type, “X”, which means that the width of this column will be determined in relation to the width of the entire table. The rest of the table setup is exactly the same as in the tabular environment.
\begin{center}
\begin{tabularx}{0.6\textwidth}{X|X|X}
\textbf{Col. 1} & \textbf{Col. 2} & \textbf{Col. 3} \\ [0.5ex]
\hline \hline
1 & 2 & 3 \\
\hline
4 & 5 & 6 \\
\hline
7 & 8 & 9 \\
\hline
10 & 11 & 12 \\
\hline
13 & 14 & 15 \\
\end{tabularx}
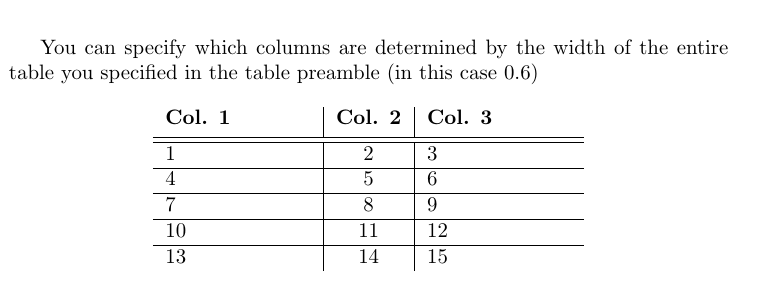
\end{center}In the tabularx environment, you can also mix the X column type with the tabular column type (l, r, c), so that the width of some of the columns is determined by overall table width (the X columns), while the width of others is determined by the width of the text/fixed (the l, r, c).
Some of the columns can be determined by the width of the table, while either will be determined by the width of the text within them (using the default tabular formats – c for centred (l, r, c).
\begin{center}
\begin{tabularx}{0.6\textwidth}{X|c|X}
\textbf{Col. 1} & \textbf{Col. 2} & \textbf{Col. 3} \\ [0.5ex]
\hline \hline
1 & 2 & 3 \\
\hline
4 & 5 & 6 \\
\hline
7 & 8 & 9 \\
\hline
10 & 11 & 12 \\
\hline
13 & 14 & 15 \\
\end{tabularx}
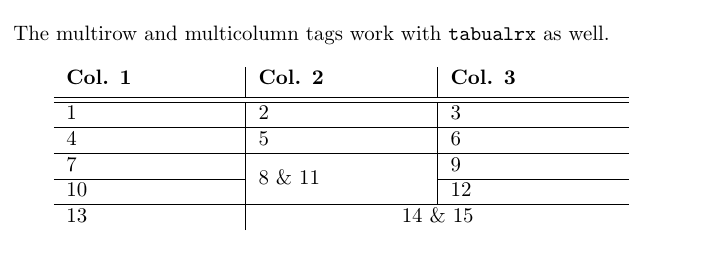
\end{center}Finally, merging columns and rows can be applied in tabularx, just as in tabular:
\begin{center}
    \begin{tabularx}{0.8\textwidth}{X|X|X}
        \textbf{Col. 1} & \textbf{Col. 2} & \textbf{Col. 3} \\ [0.5ex]
        \hline \hline
        1 & 2 & 3 \\
        \hline
        4 & 5 & 6 \\
        \hline
        7 & \multirow{2}*{8 \& 11} & 9 \\
        \cline{1-1} \cline{3-3}
        10 & & 12 \\
        \hline
        13 & \multicolumn{2}{c}{14 \& 15} \\
    \end{tabularx}
\end{center}
Defining New Column Types
As you might have noticed, the default “X” column type in LaTeX is not centred, and by default, we have no control over its positioning. However, this can be changed by defining a new column type in the document preamble, after you define all the packages used.
The \newcolumntype command defines a new column type for the tabularx environment based on the default X column. The content of the first curly braces following the command is just the name we assign to the newly created column. Note that the name always has to be a single letter. In this case, for the sake of convenience and clarity, it’s good to name newly defined columns with capital letters (i.e. R for right justification, C for centring and L for left justification) – this makes them easy to remember and we avoid confusing them with the tabular column types defined with small letters.
The second curly braces contain the definition of the new column type. Without going into too much detail, it’s sufficient to remember that, counter-intuitively, \raggedright defines to tabularx column to be justified to the left, \centering to be centred and \raggedleft to be justified to the right. It’s important to remember that these columns can be manually defined, rather than to memorize the exact content of the \newcolumntype command – whenever you will need it, you can just simply copy and paste it.
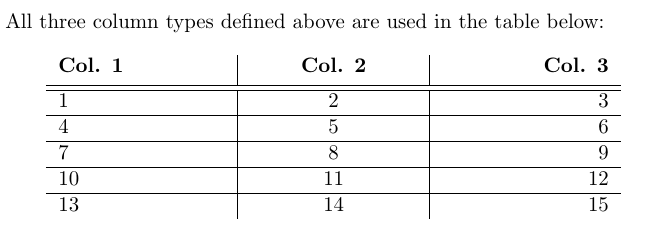
As you can see in the example, with these newly defined columns we are able to control the justification of the cell content.
\documentclass{article}
\usepackage{multirow}
\usepackage{tabularx}
\newcolumntype{L}{>{\raggedright\arraybackslash}X}
\newcolumntype{C}{>{\centering\arraybackslash}X}
\newcolumntype{R}{>{\raggedleft\arraybackslash}X}
\begin{document}
All three column types defined above are used in the table below:
\begin{center}
\begin{tabularx}{0.8\textwidth}{L|C|R}
\textbf{Col. 1} & \textbf{Col. 2} & \textbf{Col. 3} \\ [0.5ex]
\hline \hline
1 & 2 & 3 \\
\hline
4 & 5 & 6 \\
\hline
7 & 8 & 9 \\
\hline
10 & 11 & 12 \\
\hline
13 & 14 & 15 \\
\end{tabularx}
\end{center}
\end{document}
The \newcolumntype command also allows to make many other modifications and create your own, customizable column layouts. For example, by using \newcolumntype{y}[1]{>{\centering\arraybackslash}m{#1}} we can create a column type ‘y’, which is based on the type m (i.e. has a specified width and centres the text vertically), but also additionally applies horizontal centering as well. Generally, however, you don’t need to worry about understanding the intricacies of the \newcolumntype syntax – usually, when you need to customize your columns, it’s enough to just search for suggestions online – it’s likely that some other people have encountered the problem before you, and the solution is already out there. Nevertheless, the ability to specify the width of a table to a fixed number and the customizability of the column types often makes the tabularx package more useful that the basic tabular.
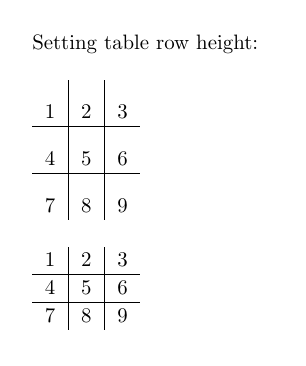
Specifying Row Height
also makes it possible to set the height of rows in your document to a fixed value. You can do this by adding \setlength{\extrarowheight{height}} before the table in which you want to change the row heights. Every row of each table following this line in your .tex file will have this exact height. To change it back to the default setting, simply use \setlength{\extrarowheight{1pt}}.
Here’s an example of how it works:
\bigskip
%increase the row height
\setlength{\extrarowheight}{10pt}
\begin{tabular}{c|c|c}
1 & 2 & 3 \\
\hline
4 & 5 & 6 \\
\hline
7 & 8 & 9 \\
\end{tabular}
\bigskip
%return to default values
\setlength{\extrarowheight}{1pt}
\begin{tabular}{c|c|c}
1 & 2 & 3 \\
\hline
4 & 5 & 6 \\
\hline
7 & 8 & 9 \\
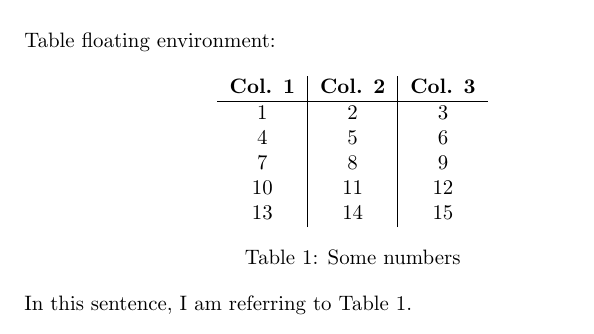
\end{tabular}The ‘Table’ Floating Environment
Similarily to figures, tables also have their own float environment in LaTeX. As you may remember, the floating environments allow to control the positioning of an object in the document. You can also add captions to these environments, as well as label them, which makes referencing tables anywhere in the document much easier.
\begin{table}[h!]
    \centering
    \begin{tabular}{c|c|c}
        \textbf{Col. 1} & \textbf{Col. 2} &\textbf{Col. 3}\\
        \hline
        1 & 2 & 3 \\
        4 & 5 & 6 \\
        7 & 8 & 9 \\
        10 & 11 & 12 \\
        13 & 14 & 15 \\
    \end{tabular}
\caption{Some numbers}
\label{tab:num1}
\end{table}

In this sentence, I am referring to Table \ref{tab:num1}.