Missing Data
Options in R
Missing data is a real problem in doing empirical research. What compounds this problem is that developing countries are more affected than developed ones. Ironically, we are more interested in developing countries in this module, and so this is going to become a real-life struggle for you over the coming weeks.
R has multiple ways in which to address missing data. We have already encountered the exclusion of missing values when using descriptive statistics within the setx function in Week 3, such as:
When we run regression models, for example through the function lm, R let’s you specify what you wish to do with observations (rows) that have missing values in them with the function na.action. This option has four logical options7:
na.fail: Stop if any missing values are encounteredna.omit: Drop out any rows with missing values anywhere in them and forgets them forever.na.exclude: Drop out rows with missing values, but keeps track of where they were (so that when you make predictions, for example, you end up with a vector whose length is that of the original response.)na.pass: Take no action
By default, R would apply na.omit which we call “listwise deletion”. This means, that as soon as one value within an observation is missing, R drops that entire observation. This can potentially decimate the number of observations for analysis quite drastically! This in turn has implications for inference. Let me illustrate this.
Methodological Implications
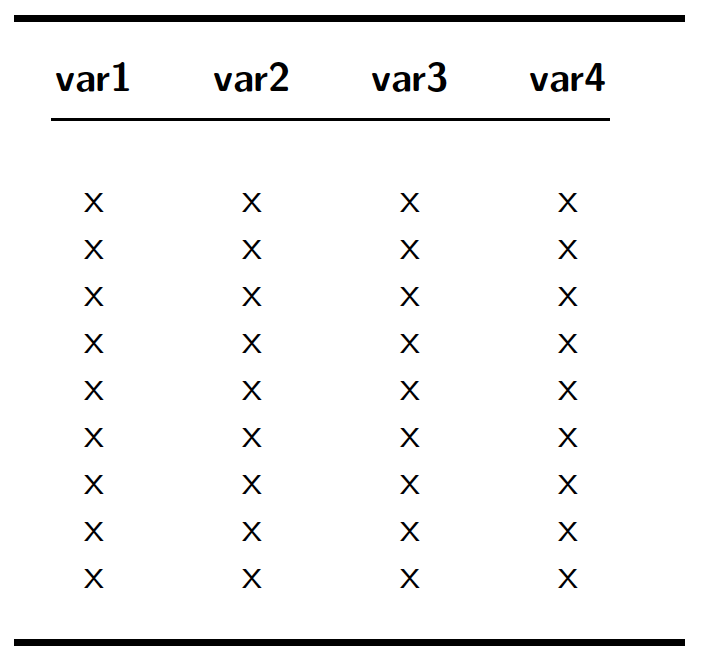
In an ideal world, we would have a data set in which each value is present (indicated by the presence of an x in each of the cells of this table):

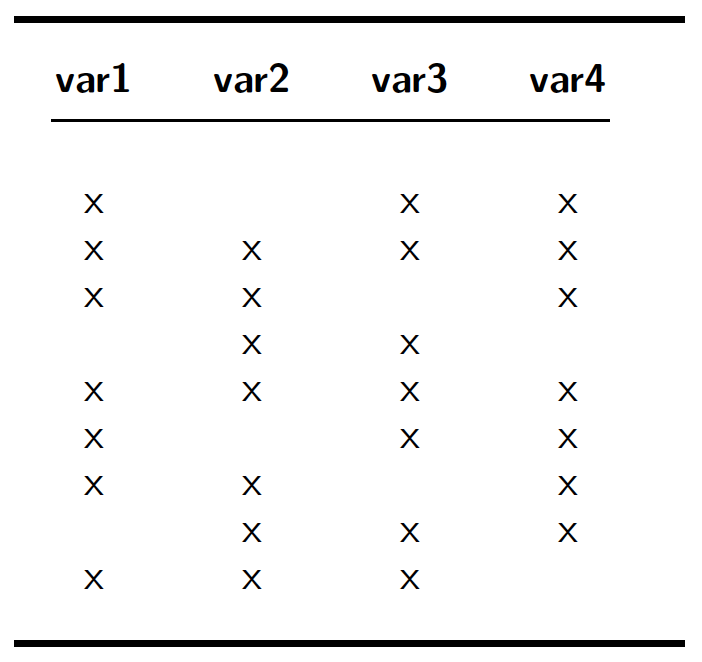
Unfortunately, in the real world, we are much more likely to have a Swiss cheese, such as this:

Figure 13: Schematic of a real data set
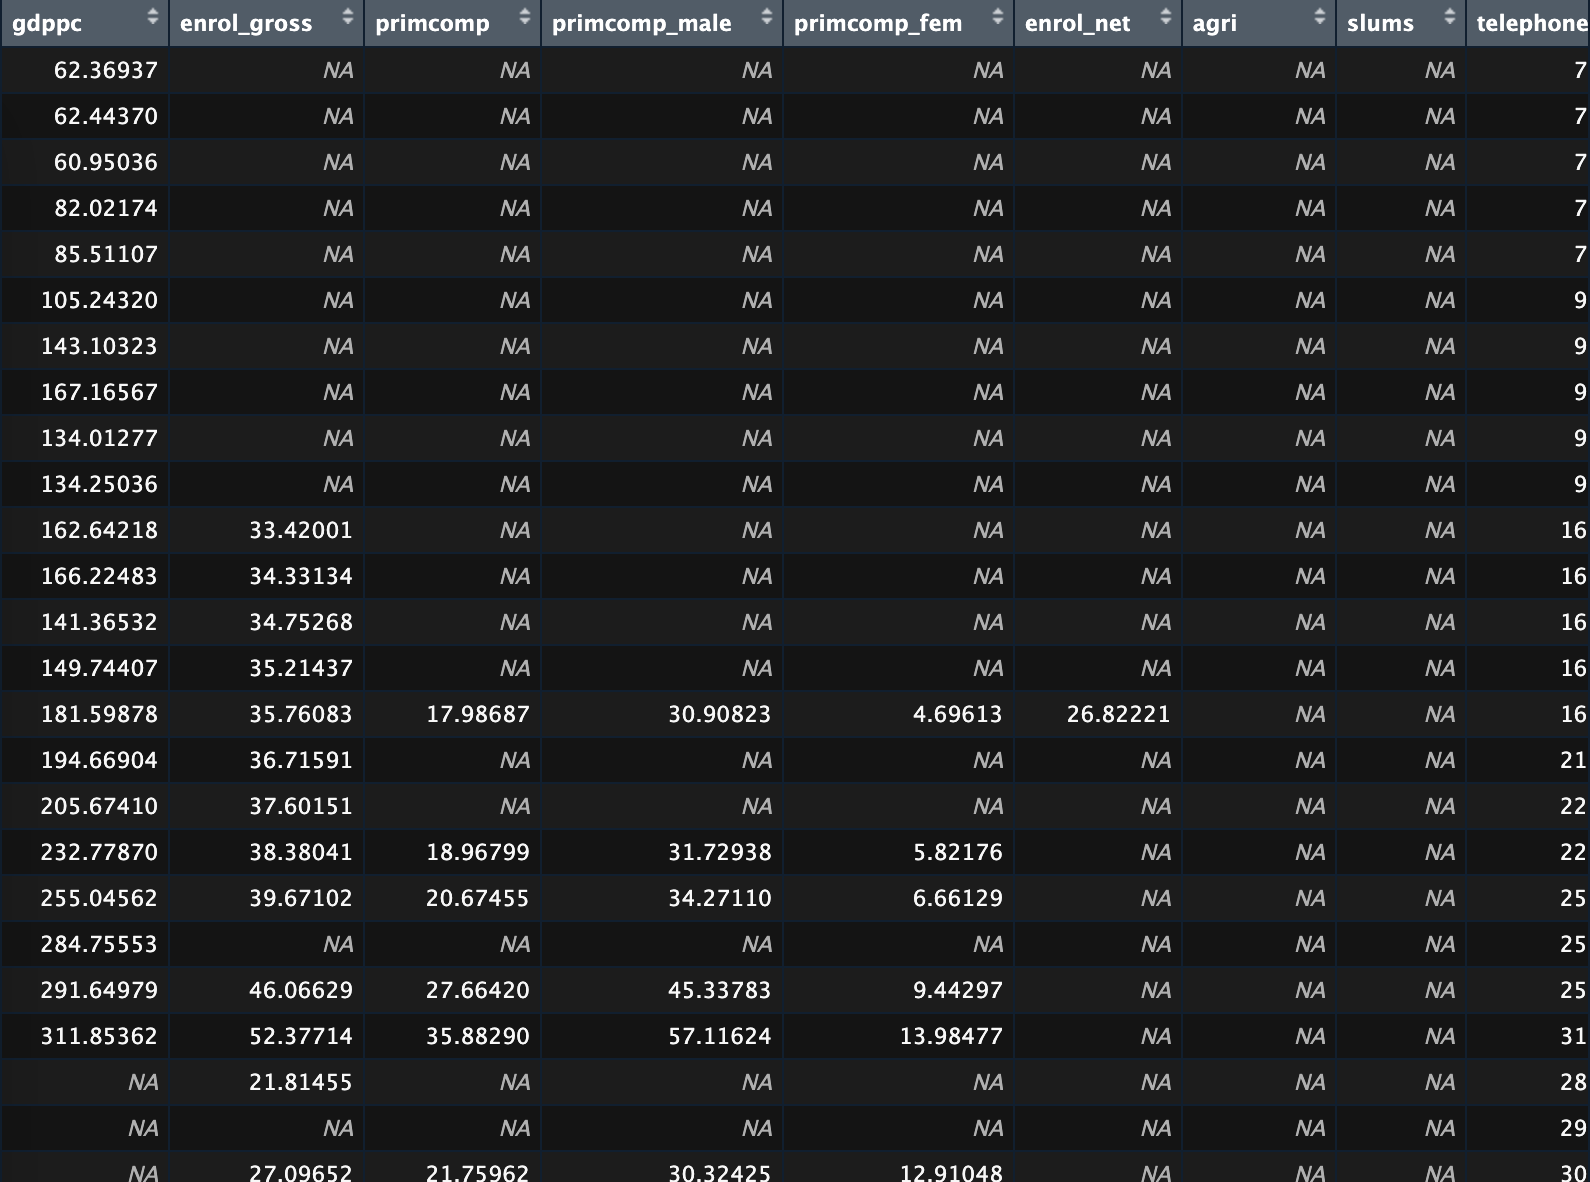
You will already have seen this when opening the data sets we are working with. In Figure 14, for example, the variable gdppc only has three missing values, but agri is completely missing.

Figure 14: Excerpt from the world data set
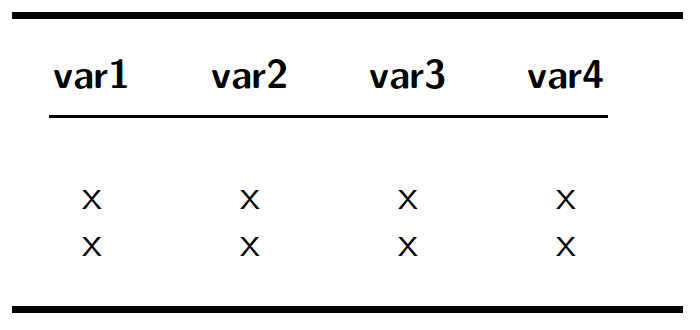
If you ran a regression model that uses the variable agri listwise deletion would delete all observations and you would end up with no model. Here, the amount of observations you would lose is obvious. But since different variables have missing values in different places, it is often not as obvious as that. Assume, for example that we wished to use all four variables in our Schematic in Figure 13. Even though the “missingness” problem looks much less pronounced than in the agri variable in the world data set (see Figure 14, listwise deletion would ensure that we would only be left with two observations out of ten in our model:

So what do you do when you find yourself in such a situation? An obvious answer would be to simply leave out a variable that has a high degree of missingness. This solution is flawed, however. If your theory tells you that the variable plays a role in measuring one of the concepts then leaving it out would create so-called omitted variable bias – a problem you really don’t want to have. A much better solution, therefore, is to use a proxy variable. Take agri as an example. It measures the percentage of GDP generated by agriculture, and would probably enter a statistical model to measure the transition of a traditional society (agricultural) to a modern, industrialised society. So, rather then measuring the move away from agri, you would also measure the transformation into industry. If you can find a variable measuring the percentage of GDP generated by the industry sector, and this variable has fewer observations missing, you could you it instead of agri and still be measuring the same thing.
Sometimes, it is not as straightforward as this, however, and you will have to resort to variables that have less measurement validity. Assume, for example, you want to measure the populations ability to read. Then literacy from our data set would be an obvious choice. But sadly, it has a high number of observations missing. An alternative is primary gross enrolment (enrol_gross), as pupils learn to read and write in primary school. This variable does not measure the characteristic we are interested in as directly as literacy, but it would allow us to include more observations in our model. It is an art to balance measurement validity against the number of observations, there is no hard and fast rule to help you make this decision. But as long as you discuss and explain your reasoning in the assessment, you will be fine for this module – after all, you are only starting out on this.